On Air Now
Calm Classics with Myleene Klass 10pm - 1am
6 December 2017, 19:41 | Updated: 6 December 2017, 19:46


We all know classical music sounds good, but who knew it could look so attractive, logical and elegant. Here are a few of our favourite classical music graphics
Click for a closer look:

Want to take up a musical instrument but don't know which one? Scared that the instrument you've chosen - and have been spending all those hours practising - is not the right one for you? Our friends at CBC music have produced this very elegant (and very helpful) flowchart. Give it a go and tell us what you got.

What does listening to music actually do to you? How does it boost creativity, memory and concentration? Muzo Music's graphic gathers together some of the fascinating thoughts and theories.

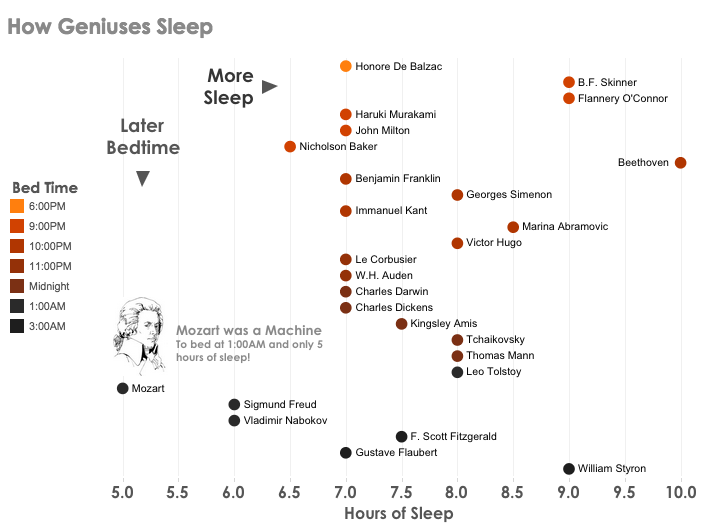
Infographics showing the bedtimes and hours of sleep of certain artistic geniuses have been doing the rounds for a while, but this visualisation of the data from the book Daily Rituals: How Artists Work by Mason Currey is particularly good, and reveals the sharp contrast between Mozart (late bedtime, five hours' sleep) and Beethoven (early to bed, 10 hours' sleep).
This is a real favourite - a look at all those things over the centuries that people have claimed will bring the artform we love to an end. Happily, none have succeeded so far, but it is a fascinating insight.

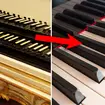
We spotted this one on Reddit. A representation of the individual key impressions in Chopin's incredibly virtuosic Etudes. It's an illuminating city of skyscrapers - and exactly the kind of data that could only be expressed in this form.

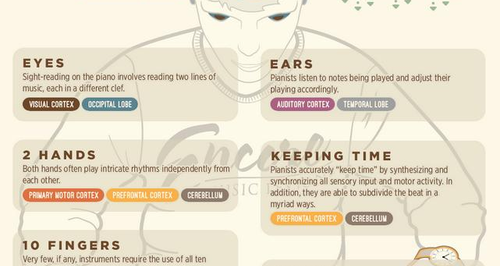
We know how it makes us feel, but have you ever wondered why it has this effect? A big question - and it's time to get a little neurosciencey and to designy to unlock the answers.
Click for a closer look...

Click for a closer look:

4 hours ago

9 hours ago